Most Kubernetes security tools tell you about vulnerabilities before deployment. Many can detect what’s happening during an attack, but they work in isolation without the correlation needed to piece together the full story.
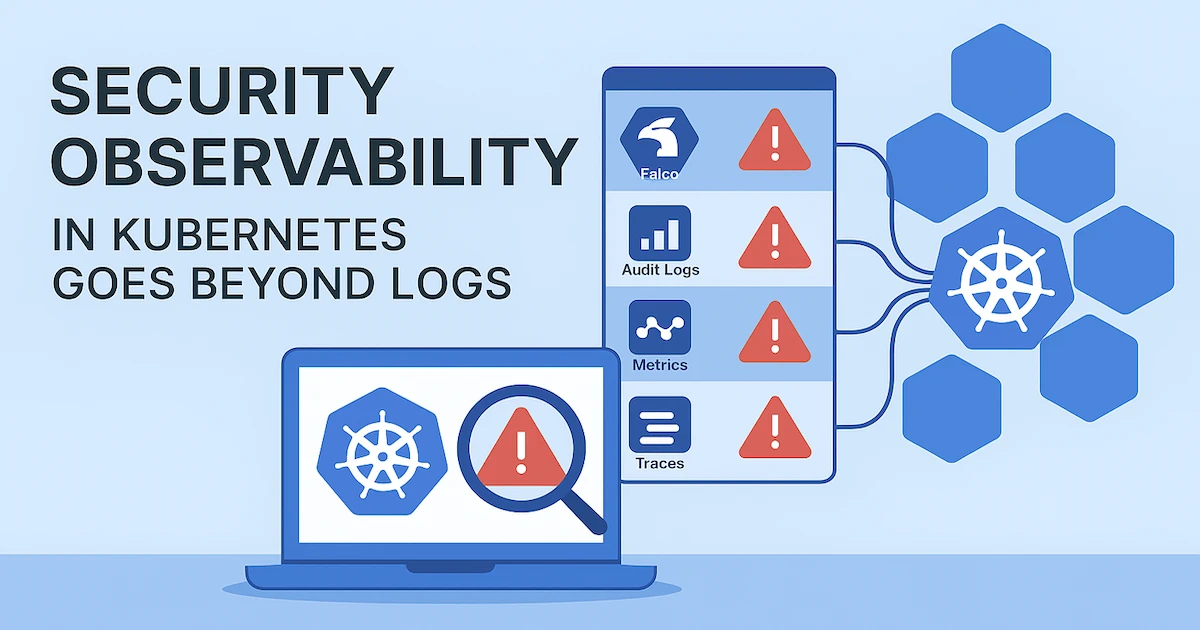
The typical security stack includes vulnerability scanners, Pod Security Standards, network policies, and runtime detection tools. But when a real incident occurs, teams often struggle to understand what happened because each tool generates signals in isolation. Audit logs show API calls. Falco catches suspicious behavior. Prometheus exposes metrics you can use to spot network spikes. But these signals live in different systems with different timestamps and zero shared context.
The problem is correlation.
That’s what observability is about.
Security observability is different from application observability. You’re not debugging slow queries or memory leaks. You’re answering “Did someone just try to escalate privileges?” and “Which pods are making unexpected API calls?” in real time. This requires audit logs, runtime behavior detection, network flow analysis, and the ability to correlate security events with application traces.
What security observability actually means Link to heading
Security observability means you can answer these questions in under 60 seconds:
- Which pods accessed secrets in the last hour?
- Did any container spawn an unexpected shell process?
- What API calls did this suspicious service account make?
- Which workloads are communicating outside their expected network boundaries?
- Can I trace this security event back to the specific user request that triggered it?
Security observability gives you investigation superpowers through correlation and context.
In the OpenTelemetry pipeline post, I showed how to unify metrics, logs, and traces. This post extends that foundation to security signals. You’ll get Kubernetes audit logs flowing through your observability pipeline, runtime security events from Falco correlated with traces and security metrics that let you spot attacks as they happen.
Kubernetes audit logs are underutilized Link to heading
Kubernetes audit logs record every API server request. User authentication, pod creation, secret access, RBAC decisions, admission webhook results. Everything that touches the API server gets logged. Most teams either disable audit logs (which is insane from a security standpoint) or dump them to S3 where they’re essentially useless during an active incident. You can’t correlate S3 logs with live application traces when you need answers in under a minute.
The Kubernetes audit documentation provides comprehensive guidance on audit logging configuration and best practices.
Here’s what you’re missing when audit logs aren’t in your observability platform:
A service account suddenly starts listing secrets across all namespaces. A user creates a pod with hostPath mounts in production. Someone deletes a critical ConfigMap. An unknown source IP hits the API server with repeated authentication failures. Without audit logs in a queryable backend with correlation to application telemetry, you’re investigating these incidents with kubectl and guessing.
I’ve seen teams spend 30 minutes trying to figure out who deleted a deployment. With audit logs in Loki and correlated by user/namespace/timestamp, it takes 15 seconds.
Configuring useful audit logs Link to heading
The default audit policy logs everything at the RequestResponse level, which means you’ll capture full request and response bodies for every API call. This generates gigabytes per day in any moderately active cluster and most of it is noise.
You want a policy that captures security-relevant events at appropriate detail levels while dropping low value spam like constant healthcheck requests.
apiVersion: audit.k8s.io/v1
kind: Policy
rules:
  # Don't log read-only requests to common resources
  - level: None
    verbs: ["get", "list", "watch"]
    resources:
      - group: ""
        resources: ["pods", "pods/status", "nodes", "nodes/status"]

  # Log secret access with metadata (who, when, which secret)
  - level: Metadata
    resources:
      - group: ""
        resources: ["secrets", "configmaps"]

  # Log RBAC changes with full request details
  - level: RequestResponse
    verbs: ["create", "update", "patch", "delete"]
    resources:
      - group: "rbac.authorization.k8s.io"
        resources: ["clusterroles", "clusterrolebindings", "roles", "rolebindings"]

  # Log pod create/delete with request body (captures specs)
  - level: Request
    verbs: ["create", "delete"]
    resources:
      - group: ""
        resources: ["pods"]

  # Catch privilege escalations and authentication failures
  - level: RequestResponse
    omitStages: ["RequestReceived"]
    users: ["system:anonymous"]

  # Default: log metadata for everything else
  - level: Metadata
    omitStages: ["RequestReceived"]
This policy logs secret access, RBAC changes, pod mutations, and authentication anomalies while dropping noisy read-only requests. It cuts audit volume by 70-80% compared to logging everything.
For managed Kubernetes (EKS, GKE, AKS), audit logs are available through cloud provider logging services. For self-managed clusters, you’ll configure the API server flags in the shipping options below.
Shipping audit logs to your observability pipeline Link to heading
Audit logs are structured JSON that you can send to any OTLP receiver or log aggregator. Choose the approach that fits your cluster setup:
Option 1: File-based logging with Fluent Bit (simplest) Link to heading
For most setups, file-based audit logging with Fluent Bit is simpler than running a webhook server. Configure the API server to write audit logs to a file, then use Fluent Bit (already running as a DaemonSet in most observability setups) to tail and forward them.
Configure API server for file-based logging:
--audit-policy-file=/etc/kubernetes/audit-policy.yaml
--audit-log-path=/var/log/kubernetes/audit/audit.log
--audit-log-format=json
Then configure Fluent Bit to parse and forward audit logs:
apiVersion: v1
kind: ConfigMap
metadata:
  name: fluent-bit-config
  namespace: observability
data:
  parsers.conf: |
    [PARSER]
        Name   k8s-audit
        Format json
        Time_Key requestReceivedTimestamp
        Time_Format %Y-%m-%dT%H:%M:%S.%LZ

  fluent-bit.conf: |
    [INPUT]
        Name              tail
        Path              /var/log/kubernetes/audit/*.log
        Parser            k8s-audit
        Tag               k8s.audit
        Refresh_Interval  5
        Mem_Buf_Limit     50MB
        Skip_Long_Lines   On

    [FILTER]
        Name    modify
        Match   k8s.audit
        Add     service.name kubernetes-audit
        Add     signal.type security

    [OUTPUT]
        Name          forward
        Match         k8s.audit
        Host          otel-gateway.observability.svc.cluster.local
        Port          24224
        Require_ack_response  true
This requires mounting /var/log/kubernetes/audit/ from the host into the Fluent Bit DaemonSet pods. No additional services needed.
Note: The OpenTelemetry Collector receiving these logs must have the fluentforward receiver enabled on port 24224 (shown in the correlation section below).
Option 2: Cloud provider native audit logs (for managed Kubernetes) Link to heading
For managed Kubernetes, use the cloud provider’s native audit log integration. EKS sends audit logs to CloudWatch Logs, GKE to Cloud Logging, and AKS to Azure Monitor. Forward them to your observability backend using the OpenTelemetry Collector’s cloud-specific receivers (CloudWatch, Google Cloud Logging, Azure Monitor) or cloud-native export mechanisms like Pub/Sub or Event Hubs. This approach avoids running additional infrastructure but creates vendor lock-in.
Option 3: Webhook backend (for specific use cases) Link to heading
Webhooks allow the API server to send audit events to an HTTP endpoint in real time. Use this only if you need custom transformation logic before forwarding to OpenTelemetry. Deploy a simple HTTP service that receives audit event batches from the API server and forwards them to your OTLP endpoint. Configure the API server with --audit-webhook-config-file pointing to your webhook. Most teams are better served by Option 1 or Option 2. Webhooks add operational complexity without clear benefits for typical use cases.
Which option should you choose? Link to heading
- Self-managed clusters (kubeadm, kops, etc.): Use Option 1 (Fluent Bit). You already have file access and likely run Fluent Bit for application logs.
- Managed Kubernetes with existing observability stack: Use Option 2 (cloud provider native). Simplest integration with no additional infrastructure.
- Managed Kubernetes requiring vendor neutrality: Use Option 3 (webhook) only if you need real-time streaming and can’t use Option 1 (file-based logging).
- Need custom enrichment or transformation: Use Option 3 (webhook) to add custom logic before forwarding to OpenTelemetry.
Falco catches what static scans miss Link to heading
Falco is a CNCF runtime security tool that watches system calls (via eBPF or kernel module) and triggers alerts on suspicious behavior. Shell spawned in a container. Sensitive file access. Unexpected network connections. Privilege escalation attempts. These are behavioral signals that only appear at runtime. Vulnerability scanners won’t catch these behaviors because they only happen during execution, and Falco is purpose-built to detect them.
Installing Falco with OpenTelemetry export Link to heading
Falco can export alerts to syslog, HTTP endpoints, or gRPC. You want alerts flowing into your observability pipeline as structured logs with correlation context.
Install Falco with Helm and configure JSON output:
helm repo add falcosecurity https://falcosecurity.github.io/charts
helm repo update

helm install falco falcosecurity/falco \
  --namespace falco \
  --create-namespace \
  --set tty=true \
  --set driver.kind=modern_ebpf \
  --set falco.json_output=true \
  --set falco.file_output.enabled=true \
  --set falco.file_output.filename=/var/run/falco/events.log \
  --set falco.file_output.keep_alive=false
Then configure Fluent Bit (or the OpenTelemetry Filelog Receiver) to tail Falco’s output and forward to your observability backend:
[INPUT]
    Name              tail
    Path              /var/run/falco/events.log
    Parser            json
    Tag               falco.events
    Refresh_Interval  5

[FILTER]
    Name    modify
    Match   falco.events
    Add     service.name falco
    Add     signal.type security

[OUTPUT]
    Name          forward
    Match         falco.events
    Host          otel-gateway.observability.svc.cluster.local
    Port          24224
Falco will now send alerts as JSON logs. Each alert includes pod name, namespace, process details, and the rule that triggered.
Tuning Falco rules is critical. Out of the box, you’ll get alerts for legitimate admin activity. Create a custom rules file to suppress expected behavior:
- rule: Terminal shell in container
  desc: A shell was spawned in a container
  condition: >
    spawned_process and container and
    shell_procs and proc.tty != 0 and
    not user_known_terminal_shell_activity
  output: >
    Shell spawned in container (user=%user.name container=%container.name
    shell=%proc.name parent=%proc.pname cmdline=%proc.cmdline)
  priority: WARNING

- macro: user_known_terminal_shell_activity
  condition: >
    (container.image.repository = "my-debug-image") or
    (k8s.ns.name = "development" and user.name = "admin@example.com")
This custom rule allows shells in debug images and development namespaces while alerting on everything else. Start with WARNING priority, review alerts weekly, and gradually tighten rules as you understand normal behavior.
Correlating security events with application traces Link to heading
Correlation requires shared context: trace_id, namespace, pod, service.name. When your application logs include trace IDs and your security logs (audit + Falco) include the same pod/namespace/service metadata, you can navigate from a suspicious API call to the exact request that caused it.
Here’s the key insight: use the OpenTelemetry Collector’s k8sattributes processor to enrich all signals with Kubernetes metadata, then ensure applications inject trace context into every log line.
The gateway Collector config from the OpenTelemetry post already has k8sattributes enrichment. Extend it to process security logs. The k8sattributes processor documentation provides detailed configuration options and performance considerations.
Ensure the OpenTelemetry Collector has RBAC permissions:
apiVersion: v1
kind: ServiceAccount
metadata:
  name: otel-collector
  namespace: observability
---
apiVersion: rbac.authorization.k8s.io/v1
kind: ClusterRole
metadata:
  name: otel-collector
rules:
- apiGroups: [""]
  resources: ["pods", "namespaces", "nodes"]
  verbs: ["get", "list", "watch"]
- apiGroups: ["apps"]
  resources: ["replicasets", "deployments"]
  verbs: ["get", "list", "watch"]
---
apiVersion: rbac.authorization.k8s.io/v1
kind: ClusterRoleBinding
metadata:
  name: otel-collector
roleRef:
  apiGroup: rbac.authorization.k8s.io
  kind: ClusterRole
  name: otel-collector
subjects:
- kind: ServiceAccount
  name: otel-collector
  namespace: observability
Then configure the k8sattributes processor and ensure the Collector receives Fluent Bit’s forward output on port 24224:
receivers:
  otlp:
    protocols: {grpc: {}, http: {}}
  fluentforward:
    endpoint: 0.0.0.0:24224

processors:
  k8sattributes:
    auth_type: serviceAccount
    extract:
      metadata: [k8s.namespace.name, k8s.pod.name, k8s.deployment.name, k8s.node.name]
      annotations:
        - tag_name: team
          key: team
          from: pod
      labels:
        - tag_name: app
          key: app
          from: pod

  # Add security-specific attributes
  attributes/security:
    actions:
      - key: signal.type
        value: security
        action: insert
      - key: is_security_event
        value: true
        action: insert

service:
  pipelines:
    logs:
      receivers: [fluentforward, otlp]
      processors: [k8sattributes, attributes/security, batch]
      exporters: [loki]
Now every security log (audit events, Falco alerts) gets enriched with pod name, namespace, deployment, and custom labels. When you query Loki for security events, you can filter by k8s.namespace.name="production" and signal.type="security" to see only production security logs.
With K8s metadata enrichment in place, you can now correlate security events with application traces. When suspicious behavior occurs, jump directly from the Falco alert to the trace showing the full request context.
This requires injecting trace_id into application logs. Not all security events will have trace IDs (e.g., direct kubectl commands), but application-triggered events should.
Building a security observability dashboard Link to heading
Raw logs and traces are useful for investigation, but you need high-level dashboards that show security posture and alert on anomalies.
Here’s what makes sense in a Grafana security dashboard:
Audit log metrics:
- API request rate by user/namespace/verb
- Failed authentication attempts over time
- Secret access events (who accessed which secrets)
- RBAC change events (role bindings created/deleted)
- Pod creation events with privileged specs
Falco metrics:
- Alert rate by priority (INFO/WARNING/CRITICAL)
- Top triggered rules
- Alert count by pod/namespace
- Shell spawn events in production namespaces
Correlation panel:
- Recent security events with links to traces
- Anomaly detection (API request rates outside normal range)
Use Loki queries to extract metrics from security logs:
# Count secret access events per user
count_over_time({service_name="kubernetes-audit"} | json | objectRef_resource="secrets" [5m]) by (user_username)

# Count Falco alerts by priority
count_over_time({service_name="falco"} | json | priority="CRITICAL" [5m])

# Failed authentication attempts
count_over_time({service_name="kubernetes-audit"} | json | verb="create" | responseStatus_code >= 400 [5m])
Add a correlation panel that shows recent security events with drill-down links. When an alert fires, you should be able to click through to the audit log, see the associated Falco alert if any, and jump to the application trace if the event came from an app request.
Retention policies for security logs Link to heading
Security logs have different retention requirements than application logs:
- Audit logs: 1 year minimum for most compliance frameworks. PCI-DSS requires 1 year with the last 90 days immediately available. HIPAA requires 6 years for documentation, which many organizations apply to audit logs as well. These are your legal and compliance record of who did what and when.
- Falco alerts: 30-90 days is typical. You need enough history to investigate incidents and establish baseline behavior patterns, but runtime alerts are less critical for compliance than audit logs.
- Network flows: 7-30 days given the massive volume. Keep longer retention only for compliance-required namespaces or use sampling to reduce volume.
Consider tiered storage in Loki: recent data (last 7 days) in fast storage for active investigation, older data in object storage for compliance queries. Set up log lifecycle policies to automatically expire logs based on these retention requirements. Budget for storage accordingly—audit logs and network flows can easily reach terabytes per year in production clusters.
Operationalizing security observability Link to heading
Security observability fails when it becomes another tool nobody checks. You need to integrate it into on-call workflows and incident response runbooks.
Here are approaches that work well:
Include security signals in standard dashboards. Don’t isolate security metrics in a separate dashboard that only the security team sees. Add a “Security Events” panel to the main application dashboard. When developers see their service triggering Falco alerts, they investigate.
Automate correlation in alerts. When a Falco alert fires, include the pod name and namespace in the alert. Add a link directly to the Loki query that shows related audit logs. Include the Grafana Explore URL with pre-filled filters.
Make security logs accessible to developers. Grant read access to audit logs and Falco alerts in Loki. Developers should be able to query “Which pods in my namespace accessed secrets today?” without filing a ticket.
Test your setup with attack simulations. Simulate privilege escalation and container escape attempts in a test environment. Verify that your dashboards show the activity and alerts fire. This builds confidence and identifies gaps before real incidents happen.
Extending to network security observability Link to heading
Audit logs and runtime alerts cover control plane and process behavior. But network traffic is another attack vector. Unexpected egress traffic, lateral movement between pods, data exfiltration attempts. You need network flow visibility.
Kubernetes Network Policies define allowed traffic, but they don’t give you observability into actual traffic. You need flow logs.
Tools like Cilium (with Hubble) or Calico (with flow logs) export network flow data. These can feed into your observability pipeline as metrics or logs.
Cilium Hubble exposes flow logs to files, which you can then forward to your observability pipeline. The Cilium Hubble documentation covers flow export configuration and filtering options. Configure Hubble to export flows to a file:
helm upgrade cilium cilium/cilium \
  --namespace kube-system \
  --set hubble.enabled=true \
  --set hubble.export.static.enabled=true \
  --set hubble.export.static.filePath=/var/run/cilium/hubble/events.log \
  --set "hubble.export.static.fieldMask={time,source.namespace,source.pod_name,destination.namespace,destination.pod_name,verdict,l4,IP}"
Then configure Fluent Bit to tail the Hubble flow logs and forward them to OpenTelemetry:
[INPUT]
    Name              tail
    Path              /var/run/cilium/hubble/events.log
    Parser            json
    Tag               hubble.flows
    Refresh_Interval  5
    Mem_Buf_Limit     50MB

[FILTER]
    Name    modify
    Match   hubble.flows
    Add     service.name cilium-hubble
    Add     signal.type network

[OUTPUT]
    Name          forward
    Match         hubble.flows
    Host          otel-gateway.observability.svc.cluster.local
    Port          24224
Network flows include source/dest pod, namespace, ports, protocols, verdict (allowed/denied). You can build dashboards showing denied connections (potential policy violations), unexpected egress destinations (possible data exfiltration), and high-volume pod-to-pod traffic (lateral movement).
Warning about volume: Network flow logging generates massive data volume. A large production cluster can produce tens to hundreds of gigabytes of flow logs daily, depending on workload patterns. Every TCP connection, every DNS query, every service-to-service call creates a flow record.
Use aggressive filtering with Hubble’s allowList and denyList to focus on security-relevant flows (denied connections, external egress, cross-namespace traffic) and exclude high-volume internal service mesh traffic. Consider sampling for non-compliance workloads.
For most teams, enabling flow logging selectively for production namespaces or during incident investigation is more practical than continuous full-cluster flow capture.
What you can actually build with this Link to heading
Investigation speed increases dramatically. Tracking down who modified a ClusterRole binding with kubectl and grep can take anywhere from minutes to hours, depending on what logs you have. With audit logs in Loki filtered by {service_name="kubernetes-audit"} | json | objectRef_resource="clusterrolebindings" | verb="update", you get the answer in seconds. User name, timestamp, source IP, the exact change. Done.
See the full attack chain. Audit logs show the API calls (listing secrets, creating pods). Falco catches the shell spawn. You see the complete sequence of events instead of isolated alerts.
Compliance audits get faster. “Show me all secret access in Q3 for PCI-scoped namespaces” can take hours of manual reconstruction if logs are scattered across different systems. With Loki, it’s a single query with CSV export. Done in minutes.
Alert fatigue reduces when you have context. A Falco alert fires for shell activity in production. Is it an attack or someone running kubectl exec to debug? With correlation, you see the audit log showing which user ran the exec command, their role bindings, and whether it aligns with normal behavior patterns. Real incidents stand out because you can filter out expected activity.
This doesn’t replace preventive controls. You still need vulnerability scanning, Pod Security Standards, network policies, and the practices from Shift Left Security. But when those controls fail and an incident happens, correlated security observability changes investigation time from hours to minutes.
The goal isn’t perfect visibility. It’s actionable visibility. Can you answer “What happened?” when an alert fires? Can you trace a security event back to the request that caused it? If yes, you have enough. If not, add the missing signal.
This post covered getting security signals into your observability pipeline and correlating them. The next one explores where this is heading—eBPF-native approaches, AI-assisted investigation, and the convergence of security and platform observability.
Enterprise alternatives Link to heading
The open-source approach gives you full control and flexibility, but requires ongoing maintenance. Enterprise platforms bundle these capabilities with managed infrastructure, pre-built dashboards, and support.
If you’re looking at commercial options, consider Kubernetes-native platforms (Sysdig Secure, Aqua Security, Prisma Cloud), cloud provider tools (AWS GuardDuty, Google Cloud Security Command Center, Azure Defender), or SIEM platforms with Kubernetes integrations (Elastic Security, Datadog Security Monitoring, Sumo Logic). Many teams use a mix: cloud provider tools for basic monitoring, open-source for custom correlation and deep investigation, and SIEM when compliance requires centralized reporting.
Read next: eBPF Observability and Continuous Profiling with Parca - Extend your observability stack with continuous profiling to find CPU hotspots and optimize performance without code changes.